Where Manatee's Tax Dollars Go: 25 Years of County and School Spending
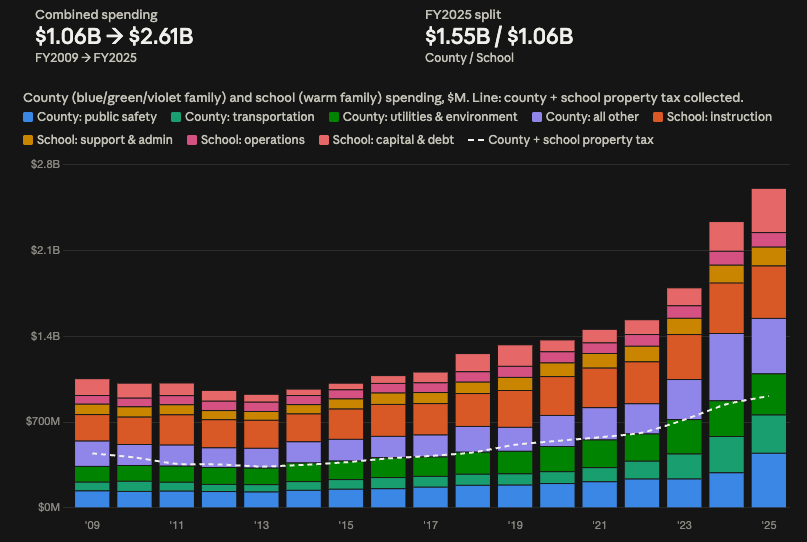
Manatee County government and the Manatee school district together spent $2.61 billion in fiscal 2025, up from $1.06 billion in fiscal 2009. Property tax paid for about 35% of it ($912 million). Both governments cut their tax rates over the period; rising property values, not rate increases, drove the growth in tax collections.
This post pulls together 25 years of public state and county data on property tax, spending by category, home values and population. Every number traces to a public source listed at the end, and every estimate or judgment call is spelled out under Methodology and assumptions.
- Spending growth is recent. About 82% of county spending growth since 2005 happened in fiscal 2020–2025.
- Capital building is the common thread. Roads, parks, utilities and new schools now run above $900 million a year across both governments.
- The school district collects more property tax than the county: $473 million vs. $440 million in fiscal 2025.
- Per resident, county plus school property tax rose from $717 (2000) to $1,954 (2025), about 2.7x, against cumulative inflation of roughly 1.8x.
Property tax: rates fell, collections quadrupled
All Manatee taxing authorities collected about $1.03 billion in property tax in fiscal 2025, up from $209 million in fiscal 2000. The school board and county government account for 88% of it; cities and independent districts (fire, water management and others) make up the rest.
| Taxing authority | FY2000 collected | FY2025 collected | Tax rate 2000 (mills) | Tax rate 2025 (mills) |
|---|---|---|---|---|
| School board | $97M | $473M | 8.68 | 6.30 |
| County government | $93M | $440M | 7.68 | 6.03 |
| Cities | $10M | $63M | set by each city | set by each city |
| Independent districts | $10M | $58M | varies | varies |
A mill is $1 of tax per $1,000 of taxable value. County rates are the countywide operating plus debt rate; the county's unincorporated-area levy (MSTU) is included in county collections but not in the rate shown.
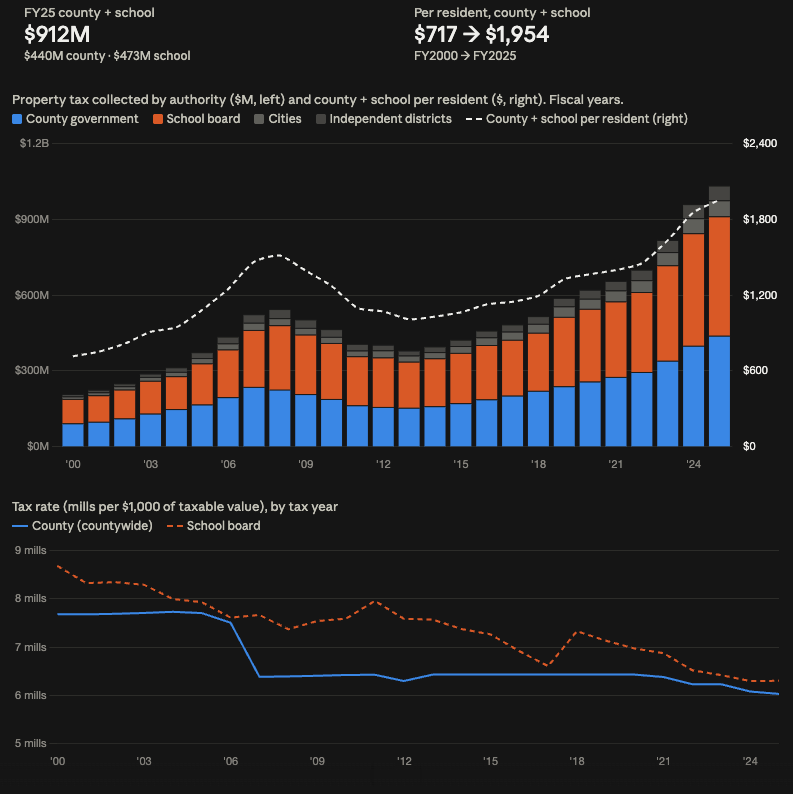
- 2007 state reform: Florida required local governments to roll back rates. The county rate fell from 7.51 to 6.39 mills in one year and stayed near 6.43 until 2021. It has been trimmed to 6.03 since.
- 2008 housing crash: County and school collections fell about a third between fiscal 2008 and 2013 as taxable values dropped. They did not regain their 2007–2008 peaks until 2017–2019.
- School rates are mostly set by the state. Most of the school levy is the required local share of the state education funding formula, which the Legislature adjusts each year.
- One voter-approved increase: Manatee voters approved an extra 1-mill school tax in March 2018 with 51.38% of the vote and renewed it in November 2021 with 69.27% (Observer). Its 2024–25 adopted budget was $75.5 million (School District of Manatee County). The 2025 school rate is flat with 2024, consistent with the extra mill remaining in place.
- Per resident: county plus school property tax was $717 per resident in fiscal 2000, peaked at $1,514 in 2008, fell to $1,009 in 2013 and reached $1,954 in 2025. This divides all county and school tax (including businesses and second homes) by population; it is not a household bill.
County government spending: $460M to $1.55B
County spending grew from $460 million in fiscal 2005 to $1.55 billion in fiscal 2025. Of the $1.09 billion increase, $889 million came after fiscal 2019. Public safety, transportation and utilities drove most of it.
| Category | FY2005 | FY2019 | FY2025 | Change FY05–25 | Main drivers |
|---|---|---|---|---|---|
| Public safety | $125M | $189M | $449M | +$324M | Hurricanes Helene and Milton (emergency and disaster relief $5M to $125M, mostly FY2025); law enforcement $68M to $183M; jail $28M to $67M; ambulance $13M to $46M |
| Transportation | $58M | $92M | $312M | +$255M | Road capital projects ($200M of FY2025 road spending was capital, vs $26M in FY2019); port $14M to $30M; transit $9M to $23M |
| Utilities and environment | $112M | $184M | $336M | +$224M | Water and sewer $70M to $211M; solid waste $32M to $79M; stormwater $4M to $25M. Funded mainly by utility fees |
| General government | $77M | $91M | $189M | +$113M | Debt service $19M to $44M; building projects; one-time $117M trust-fund entry in FY2024 |
| Parks and culture | $42M | $32M | $140M | +$99M | Park capital projects ($74M in FY2025); special recreation facilities $2M to $25M |
| Human services, economic development, courts | $48M | $73M | $123M | +$75M | Health services $5M to $21M; business development $6M to $26M; pandemic-era pass-through in FY2021 |
The Sheriff's FY2025 budget was approved at $235.1 million, a 20% increase (Bradenton Times). In 2022 the county secured $232 million in bonds to speed up 19 road projects (Sarasota Herald-Tribune via Yahoo).
- Only one line shrank over 20 years: public assistance, from $5.6 million to $2.9 million.
- Recession cuts were real but temporary. Total county spending fell from $637 million (FY2007) to $489 million (FY2013). Parks fell from $32 million to $14 million and stayed low until 2021.
- FY2025 is inflated. About $120 million of public safety spending was disaster response and should fall back.
Why the county budget is bigger than its property tax
The county's adopted net budget was $1.33 billion in fiscal 2025 (Observer) against $440 million of property tax collected. For FY2026 the net budget is $1.368 billion, with property taxes at 33.87% and service charges at 33.28% of sources (Bradenton Times). FY2025 non-property-tax revenue:
| Revenue source (FY2025) | Amount |
|---|---|
| Water, sewer and garbage charges | $318M |
| State and federal aid (incl. half-cent sales tax share $43M) | $176M |
| Bond proceeds | $167M |
| Other miscellaneous revenue (not itemized in state data) | $150M |
| Developer-contributed infrastructure (non-cash) | $133M |
| Other local taxes (infrastructure sales tax $48.5M, tourist tax $31.5M, fuel taxes about $23M) | $109M |
| Interest earnings (was $30M in FY2019) | $96M |
| Impact fees and permits | $84M |
School district spending: $509M to $1.06B
The School District of Manatee County spent $1.06 billion in fiscal 2025 (July 2024–June 2025), up from $509 million in fiscal 2009. Classroom instruction and school construction account for three-quarters of the increase.
| Function | FY2009 | FY2019 | FY2025 | Change FY09–25 | Main drivers |
|---|---|---|---|---|---|
| Instruction | $216M | $301M | $428M | +$212M | Pay and the longer school day funded by the voter-approved 1-mill tax (from 2018); enrollment growth; payments to charter schools are recorded here |
| Capital outlay (construction, equipment, land) | $91M | $142M | $323M | +$232M | New schools for growth. Low of $8M in FY2014. FY2025 funded by the 1.5-mill capital tax ($113M), half-cent school sales tax ($53M), impact fees ($41M) and $136M of lease-purchase financing |
| Instructional and student support | $44M | $53M | $82M | +$38M | Counselors, curriculum, staff training, instructional technology |
| Administration | $41M | $54M | $72M | +$31M | School administration, central office, finance, IT |
| Plant operation and maintenance | $40M | $45M | $61M | +$22M | More buildings to run; utilities and custodial |
| Food service | $19M | $29M | $38M | +$19M | Meal volume and food costs; largely federally funded |
| Student transportation | $13M | $17M | $20M | +$7M | Busing |
| Debt service | $46M | $34M | $38M | −$8M | The only school category that shrank |
The school district's fiscal year runs July–June; the county's runs October–September. Comparisons pair the years ending in the same calendar year.
School financial data in the state's current report format starts in fiscal 2009. Earlier years (2005–2008) exist in an older format and are not yet included.
Context: homes and people
The average single-family home's taxable value rose from $91,000 in 2000 to $342,000 in 2025, while population grew from 264,000 to 467,000. Values grew 3.75x and population 1.77x, so most of the rise in tax collections came from values, not new residents.
| Measure | 2000 | 2007 | 2012 | 2019 | 2025 |
|---|---|---|---|---|---|
| Average single-family taxable value | $91K | $214K | $132K | $204K | $342K |
| Single-family parcels | 58,162 | 80,418 | 86,657 | 102,887 | 130,470 |
| Population (April 1) | 264,002 | 315,890 | 330,302 | 387,414 | 466,845 |
- Taxable value is not market value. It is after the homestead exemption and the Save Our Homes cap on assessment increases, so it runs well below sale prices for long-time owners.
- The single-family parcel count more than doubled. New construction added both taxable value and demand for roads, utilities, public safety and schools.
What this analysis does not show
- Figures are nominal dollars, not adjusted for inflation. Cumulative CPI inflation 2000–2025 is roughly 1.8x (approximate, not separately sourced here).
- Spending is not a measure of value or efficiency. It does not say whether services improved, or compare Manatee to similar counties.
- Enrollment is not included. Per-student school spending would need district enrollment counts, which were not pulled.
- Cities and independent districts' spending is excluded. Their taxes appear in the tax section only.
- County spending before FY2005 and school spending before FY2009 are not included (see Methodology).
Full dataset (2000–2025)
Every annual figure behind this post, in one grid you can copy out. FY = fiscal year of collection or spending; TY = tax year (January 1 assessment). Blank cells are years the source data does not cover.
| year | county_tax_collected_FY_$M | county_tax_basis | school_tax_collected_FY_$M_est | cities_tax_FY_$M_est | ind_districts_tax_FY_$M_est | county_millage_TY | school_millage_TY | county_spending_FY_$M | school_spending_FY_$M | county_net_budget_FY_$M | avg_SFR_taxable_TY_$K | SFR_parcels_TY | population_Apr1 |
|---|---|---|---|---|---|---|---|---|---|---|---|---|---|
| 2000 | 92.8 | estimated | 96.6 | 10.0 | 9.5 | 7.6804 | 8.682 | 91.3 | 58162 | 264002 | |||
| 2001 | 99.0 | estimated | 104.9 | 11.8 | 10.1 | 7.6801 | 8.327 | 101.0 | 60773 | 270771 | |||
| 2002 | 112.3 | estimated | 114.1 | 13.1 | 11.3 | 7.6912 | 8.347 | 112.7 | 63419 | 277362 | |||
| 2003 | 131.3 | estimated | 129.8 | 15.4 | 13.3 | 7.7089 | 8.292 | 127.9 | 66254 | 286884 | |||
| 2004 | 149.2 | estimated | 130.1 | 17.3 | 18.0 | 7.7323 | 7.999 | 143.5 | 69093 | 295242 | |||
| 2005 | 167.3 | estimated | 162.7 | 21.3 | 23.0 | 7.7063 | 7.933 | 460.1 | 164.9 | 72483 | 304364 | ||
| 2006 | 196.3 | reported | 188.8 | 24.1 | 26.9 | 7.5063 | 7.614 | 525.2 | 194.3 | 76662 | 308325 | ||
| 2007 | 237.0 | reported | 225.4 | 28.5 | 33.7 | 6.3869 | 7.666 | 637.4 | 214.3 | 80418 | 315890 | ||
| 2008 | 226.4 | reported | 254.7 | 27.9 | 36.2 | 6.3949 | 7.372 | 561.6 | 204.1 | 82460 | 317699 | ||
| 2009 | 208.5 | reported | 235.5 | 26.6 | 33.5 | 6.4083 | 7.541 | 548.2 | 509.1 | 168.1 | 83713 | 318404 | |
| 2010 | 189.3 | reported | 221.6 | 24.2 | 30.6 | 6.4247 | 7.591 | 520.5 | 499.9 | 143.8 | 84465 | 322833 | |
| 2011 | 164.1 | reported | 194.2 | 22.7 | 26.2 | 6.4296 | 7.96 | 515.5 | 506.7 | 136.6 | 85563 | 325905 | |
| 2012 | 157.7 | reported | 195.9 | 28.1 | 22.2 | 6.2993 | 7.589 | 493.0 | 468.3 | 131.6 | 86657 | 330302 | |
| 2013 | 154.4 | reported | 182.4 | 24.4 | 19.9 | 6.4326 | 7.572 | 489.1 | 440.4 | 137.1 | 87999 | 333880 | |
| 2014 | 160.5 | reported | 189.6 | 24.7 | 22.4 | 6.4326 | 7.376 | 542.3 | 429.7 | 146.5 | 90524 | 339545 | |
| 2015 | 172.5 | reported | 199.1 | 27.3 | 24.9 | 6.4326 | 7.267 | 562.3 | 457.9 | 540.8 | 158.6 | 92392 | 349334 |
| 2016 | 187.7 | reported | 215.2 | 30.3 | 26.7 | 6.4326 | 6.92 | 586.5 | 496.0 | 563.9 | 169.5 | 94605 | 357591 |
| 2017 | 202.5 | reported | 220.9 | 32.5 | 28.5 | 6.4326 | 6.608 | 597.7 | 513.7 | 578.8 | 182.0 | 97332 | 368782 |
| 2018 | 221.5 | reported | 229.8 | 35.4 | 30.4 | 6.4326 | 7.331 | 667.7 | 594.4 | 628.1 | 193.4 | 100009 | 377826 |
| 2019 | 239.5 | reported | 274.7 | 41.6 | 33.4 | 6.4326 | 7.135 | 660.2 | 673.5 | 737.8 | 204.4 | 102887 | 387414 |
| 2020 | 258.2 | reported | 287.8 | 40.0 | 35.5 | 6.4326 | 6.972 | 757.4 | 616.1 | 757.0 | 214.1 | 105550 | 399710 |
| 2021 | 276.5 | reported | 298.7 | 43.7 | 37.5 | 6.3826 | 6.876 | 820.7 | 638.8 | 740.0 | 227.7 | 108768 | 411209 |
| 2022 | 296.1 | reported | 316.5 | 46.7 | 41.6 | 6.2326 | 6.522 | 852.6 | 685.7 | 923.4 | 263.6 | 112869 | 421768 |
| 2023 | 340.5 | reported | 377.8 | 52.3 | 48.0 | 6.2326 | 6.421 | 1050.5 | 748.0 | 1072.4 | 299.9 | 117615 | 439566 |
| 2024 | 399.8 | reported | 445.4 | 59.3 | 55.9 | 6.0826 | 6.299 | 1426.0 | 913.3 | 1220.6 | 330.0 | 124027 | 455356 |
| 2025 | 439.6 | reported | 472.5 | 63.4 | 58.4 | 6.0326 | 6.304 | 1549.0 | 1061.0 | 1328.2 | 342.3 | 130470 | 466845 |
Methodology and assumptions
Each item below names what was measured, how, and what judgment calls were made. Numbers labeled estimated are calculated, not reported.
Property tax
- County tax collected, FY2006–2025, is reported. It is account 311 (ad valorem taxes) from the county's Annual Financial Reports, compiled by the Florida Legislature's Office of Economic and Demographic Research (EDR). The Custodial Fund column is excluded, because from FY2021 it holds taxes the county collects on behalf of other governments.
- County tax collected, FY2000–2005, is estimated. Estimate = county government taxes levied in the prior tax year (Department of Revenue) × the countywide share of the roll actually collected that year (DOR tax roll reconciliation, all authorities). Ratios used: 95.96%, 94.02%, 95.46%, 95.63%, 95.81%, 96.15%. Check: the method gives $195.6M for FY2006 vs $196.3M reported (0.4% off).
- "County government" levy = countywide operating + countywide debt service + county dependent special districts + the unincorporated-area MSTU and any less-than-countywide county levies.
- School, city and independent district collections are all estimated for every year: each authority's levy for the prior tax year × that year's collection ratio. From FY2006 the ratio is the county's reported collections ÷ county levy (about 96%; the gap is mostly the 4% early-payment discount). In FY2009 and FY2013 that ratio was abnormal (97.6% and 98.6%, likely timing) so 96.5% was used for non-county authorities.
- Timing: a tax year's levy (assessed January 1) is billed in November and collected in the following fiscal year. Tax year 2024 funds county FY2025 and school FY2025.
- Tax rates (millage) are DOR reported rates. County = countywide operating + debt service (MSTU excluded). School = operating + debt, including the voter-approved mill from 2018.
- Per resident = estimated county + school collections ÷ that year's April 1 population. It includes taxes paid by businesses and non-resident owners, so it overstates a typical household's bill.
County spending
- Source: EDR's tabulation of the county's Annual Financial Reports (FY2005–2025), all fund types, by function account code.
- Excluded to avoid double counting: Internal Service funds (charges between departments), Custodial funds (pass-through), and "Other Uses and Non-Operating" (account 581 interfund transfers and 590 proprietary non-operating disbursements).
- Included: Enterprise funds (water, sewer, solid waste, port, transit), which are mostly fee-funded, and capital project funds.
- Grouping: Human services, economic environment and court-related were combined as one category. Account names changed slightly over the years, so line items were matched by account code.
- Driver attributions (hurricanes, pandemic pass-through, debt payoff) are inferences from the account and fund pattern plus news reports; the FY2024 $117M Financial and Administrative entry is recorded in a Trust fund and its purpose was not confirmed.
County budget and revenue mix
- Budget = adopted net budget from the county's budget books (FY2015–2025), which excludes reserves, interfund transfers, internal services and prior-year carryover. The gross budget is about 2.5x larger. Earlier budget books are not posted, so pre-2015 budgets are omitted. The FY2026 figure ($1.368B) is in the books as "$1,368,1296,426"; the rounded figure from news coverage is used.
- Revenue mix comes from the same EDR revenue tabulation for FY2025, excluding Custodial and Internal Service funds. "Other local taxes" = general government taxes minus ad valorem.
School district spending
- Source: the district's Annual Financial Reports (form ESE 348) published by the Florida Department of Education, FY2008-09 through FY2024-25, all governmental funds. Figures were extracted from the PDF statements by script.
- Method: for the General Fund and each special revenue fund, the Total column by function code; food service from that fund's total expenditures; capital outlay from capital projects funds (object codes 610–699 and 792–796) plus functions 7410, 7420 and 9300 in other funds; debt service from debt service and capital projects funds (object codes 710–791). Interfund transfers excluded. Internal service funds not included.
- Grouping: Support = functions 6100–6500 and 9100; Administration = 7100, 7200, 7300, 7500, 7700, 8200; Plant = 7900 and 8100.
- Not cross-checked against the district's audited financial statements; small differences from audited totals are possible.
Homes and population
- Average single-family taxable value = total county taxable value of single-family residential parcels ÷ number of those parcels, from DOR parcel-count reports. DOR's property-type groupings changed over time (mobile-home counts drop sharply around 2014), which can shift a small number of parcels between categories.
- Population = University of Florida BEBR April 1 estimates, as compiled by EDR, with census counts for 2000, 2010 and 2020.
General
- All dollar figures are nominal. Rounded to the nearest $0.1M in the dataset and $1M in the text.
- Fiscal years: county October–September; school July–June. Charts and comparisons pair years ending in the same calendar year.
- Analysis assembled with Claude (Anthropic's AI assistant), which downloaded the source files and ran the calculations. Every source file is public and the steps above are enough to reproduce the figures.
Sources
All files were downloaded on October 13, 2026. Primary government data is listed first; news coverage was used only for context and budget figures noted above.
Primary data
| Data used | Publisher | Link |
|---|---|---|
| County spending by function and revenue by source, FY2005–2025 (Annual Financial Reports) | Florida Legislature, Office of Economic and Demographic Research (EDR) | County revenues and expenditures index · Manatee expenditures (xlsx) · Manatee revenues (xlsx) |
| Taxes levied, millage rates, tax roll collections, single-family parcel counts and taxable values, 1999–2025 | Florida Department of Revenue, Property Tax Oversight (Ad Valorem Valuation and Tax Data Book) | Data Book page · Historical data books (folder index). Files used: 1999–2009 PDF data books; parcel_count and millage_taxes_levied workbooks for 2010–2025 |
| Population, April 1, 2000–2025 | University of Florida BEBR, compiled by EDR | Florida population products · County population history (xlsx) |
| School district spending by function, FY2008-09 to FY2024-25 | Florida Department of Education, School District Annual Financial Reports | AFR index · e.g. 2024-25 Manatee AFR (pdf), 2022-23 Manatee AFR (pdf) |
| Adopted net budgets, FY2015–2026 | Manatee County Financial Management Department, adopted budget books FY16–FY26 | Budget Division page |
Context and news coverage
| Fact used | Source |
|---|---|
| FY2025 net budget $1,328,221,815; gross $3.27B | Observer, Sept. 24, 2024 |
| Sheriff FY2025 budget $235.1M (+20%) | Bradenton Times |
| FY2026 net budget $1.368B; property taxes 33.87% and service charges 33.28% of sources | Bradenton Times |
| $232M in road bonds for 19 projects | Sarasota Herald-Tribune (via Yahoo News) |
| School 1-mill referendum: 2018 approval 51.38%, 2021 renewal 69.27% | Observer, Oct. 28, 2024 |
| 1-mill referendum 2024-25 budget $75.5M | School District of Manatee County |